Plotting Gaze Data#
The pymovements library provides a collection of built-in plotting functions to visualize gaze data in both temporal and spatial dimensions.
These functions make it easy to explore and present your data, from individual trial visualizations to aggregated participant-level analyses.
In this tutorial, you’ll learn how to:
load and prepare a sample dataset for plotting
compute the necessary events and properties
plot gaze traces over time (traceplot)
visualize fixations on a stimulus (scanpathplot)
generate heatmaps showing gaze density (heatmap)
plot the saccadic main sequence (main-sequence)
style the plot
All examples use the small ToyDataset that comes with pymovements.
Loading and preprocessing data#
import polars as pl

import pymovements as pm

dataset = pm.Dataset('ToyDataset', path='data/ToyDataset')
dataset.download()
dataset.load()

# Convert the raw x and y coordinates in pixels to degrees of visual angle
dataset.pix2deg()

# Compute gaze velocities in dva/s from dva coordinates.
dataset.pos2vel('smooth')
INFO:pymovements.dataset.dataset:
        You are downloading the pymovements Toy Dataset. Please be aware that pymovements does not
        host or distribute any dataset resources and only provides a convenient interface to
        download the public dataset resources that were published by their respective authors.

        Please cite the referenced publication if you intend to use the dataset in your research.
Using already downloaded and verified file: data/ToyDataset/downloads/pymovements-toy-dataset.zip
Extracting pymovements-toy-dataset.zip to data/ToyDataset/raw
Extracting archive: 0%| | 0/23 [00:00<?, ?file/s]
Extracting archive: 100%|██████████| 23/23 [00:00<00:00, 306.73file/s]
-
DatasetDefinitionDatasetDefinition
-
NoneNone
-
NoneNone
-
NoneNone
-
NoneNone
-
ExperimentExperiment
-
EyeTrackerEyeTracker
-
NoneNone
-
NoneNone
-
NoneNone
-
NoneNone
-
10001000
-
NoneNone
-
NoneNone
-
-
10001000
-
ScreenScreen
-
6868
-
30.230.2
-
10241024
-
'upper left''upper left'
-
3838
-
12801280
-
15.59938648778295315.599386487782953
-
-15.599386487782953-15.599386487782953
-
12.50804441088254612.508044410882546
-
-12.508044410882546-12.508044410882546
-
-
-
NoneNone
-
dict (1 items)
-
'trial_{text_id:d}_{page_id:d}.csv''trial_{text_id:d}_{page_id:d}.csv'
-
-
dict (1 items)
-
dict (2 items)
-
<class 'int'><class 'int'>
-
<class 'int'><class 'int'>
-
-
-
TrueTrue
-
'pymovements Toy Dataset''pymovements Toy Dataset'
-
dict (0 items)
-
'ToyDataset''ToyDataset'
-
NoneNone
-
NoneNone
-
list (1 items)
-
ResourceDefinition
-
'gaze''gaze'
-
'pymovements-toy-dataset.zip''pymovements-toy-dataset.zip'
-
'trial_{text_id:d}_{page_id:d}.csv''trial_{text_id:d}_{page_id:d}.csv'
-
dict (2 items)
-
<class 'int'><class 'int'>
-
<class 'int'><class 'int'>
-
-
NoneNone
-
dict (4 items)
-
'timestamp''timestamp'
-
'ms''ms'
- (2 more)
-
-
'256901852c1c07581d375eef705855d6''256901852c1c07581d375eef705855d6'
-
NoneNone
-
str'https://github.com/pymovements/pymovements-toy-dataset/archive/refs/heads/main.zip'
-
-
ResourceDefinition
-
NoneNone
-
NoneNone
-
NoneNone
-
NoneNone
-
-
tuple (20 items)
-
Events
-
DataFrame (4 columns, 0 rows)shape: (0, 4)
name onset offset duration str i64 i64 i64 -
NoneNone
-
-
Events
-
DataFrame (4 columns, 0 rows)shape: (0, 4)
name onset offset duration str i64 i64 i64 -
NoneNone
-
- (18 more)
-
Events
-
dict (1 items)
-
DataFrame (3 columns, 20 rows)shape: (20, 3)
text_id page_id filepath i64 i64 str 0 1 "pymovements-toy-dataset-main/d… 0 2 "pymovements-toy-dataset-main/d… 0 3 "pymovements-toy-dataset-main/d… 0 4 "pymovements-toy-dataset-main/d… 0 5 "pymovements-toy-dataset-main/d… … … … 3 1 "pymovements-toy-dataset-main/d… 3 2 "pymovements-toy-dataset-main/d… 3 3 "pymovements-toy-dataset-main/d… 3 4 "pymovements-toy-dataset-main/d… 3 5 "pymovements-toy-dataset-main/d…
-
-
list (20 items)
-
Gaze
-
DataFrame (6 columns, 17223 rows)shape: (17_223, 6)
time stimuli_x stimuli_y pixel position velocity i64 f64 f64 list[f64] list[f64] list[f64] 1988145 -1.0 -1.0 [206.8, 152.4] [-10.697598, -8.852399] [null, null] 1988146 -1.0 -1.0 [206.9, 152.1] [-10.695183, -8.859678] [null, null] 1988147 -1.0 -1.0 [207.0, 151.8] [-10.692768, -8.866956] [1.610194, -5.256267] 1988148 -1.0 -1.0 [207.1, 151.7] [-10.690352, -8.869381] [0.402548, -4.447465] 1988149 -1.0 -1.0 [207.0, 151.5] [-10.692768, -8.874233] [0.402561, -3.234462] … … … … … … 2005363 -1.0 -1.0 [361.0, 415.4] [-6.932438, -2.386672] [-63.266374, -21.085616] 2005364 -1.0 -1.0 [358.0, 414.5] [-7.006376, -2.408998] [-63.249652, -19.431326] 2005365 -1.0 -1.0 [355.8, 413.8] [-7.060582, -2.426362] [-60.359624, -15.710061] 2005366 -1.0 -1.0 [353.1, 413.2] [-7.12709, -2.441245] [null, null] 2005367 -1.0 -1.0 [351.2, 412.9] [-7.173881, -2.448686] [null, null] -
EventsEvents
-
DataFrame (4 columns, 0 rows)shape: (0, 4)
name onset offset duration str i64 i64 i64 -
NoneNone
-
-
NoneNone
-
ExperimentExperiment
-
EyeTrackerEyeTracker
-
NoneNone
-
NoneNone
-
NoneNone
-
NoneNone
-
10001000
-
NoneNone
-
NoneNone
-
-
10001000
-
ScreenScreen
-
6868
-
30.230.2
-
10241024
-
'upper left''upper left'
-
3838
-
12801280
-
15.59938648778295315.599386487782953
-
-15.599386487782953-15.599386487782953
-
12.50804441088254612.508044410882546
-
-12.508044410882546-12.508044410882546
-
-
-
-
Gaze
-
DataFrame (6 columns, 29799 rows)shape: (29_799, 6)
time stimuli_x stimuli_y pixel position velocity i64 f64 f64 list[f64] list[f64] list[f64] 2008305 -1.0 -1.0 [141.4, 153.6] [-12.268583, -8.823284] [null, null] 2008306 -1.0 -1.0 [141.1, 153.2] [-12.275749, -8.832989] [null, null] 2008307 -1.0 -1.0 [140.7, 152.8] [-12.285302, -8.842695] [-5.572617, -6.065816] 2008308 -1.0 -1.0 [140.6, 152.7] [-12.28769, -8.845121] [-3.582268, -4.043733] 2008309 -1.0 -1.0 [140.5, 152.6] [-12.290078, -8.847547] [-2.388085, -2.021821] … … … … … … 2038099 -1.0 -1.0 [273.8, 773.8] [-9.071149, 6.490168] [1.21962, 1.635403] 2038100 -1.0 -1.0 [273.8, 774.1] [-9.071149, 6.497527] [1.626175, 4.497406] 2038101 -1.0 -1.0 [273.9, 774.5] [-9.06871, 6.50734] [1.626186, 1.635423] 2038102 -1.0 -1.0 [274.0, 774.4] [-9.066271, 6.504886] [null, null] 2038103 -1.0 -1.0 [274.0, 773.9] [-9.066271, 6.492621] [null, null] -
EventsEvents
-
DataFrame (4 columns, 0 rows)shape: (0, 4)
name onset offset duration str i64 i64 i64 -
NoneNone
-
-
NoneNone
-
ExperimentExperiment
-
EyeTrackerEyeTracker
-
NoneNone
-
NoneNone
-
NoneNone
-
NoneNone
-
10001000
-
NoneNone
-
NoneNone
-
-
10001000
-
ScreenScreen
-
6868
-
30.230.2
-
10241024
-
'upper left''upper left'
-
3838
-
12801280
-
15.59938648778295315.599386487782953
-
-15.599386487782953-15.599386487782953
-
12.50804441088254612.508044410882546
-
-12.508044410882546-12.508044410882546
-
-
-
- (18 more)
-
Gaze
-
PosixPath('data/ToyDataset')PosixPath('data/ToyDataset')
-
DatasetPathsDatasetPaths
-
PosixPath('data/ToyDataset')PosixPath('data/ToyDataset')
-
PosixPath('data/ToyDataset/downloads')PosixPath('data/ToyDataset/downloads')
-
PosixPath('data/ToyDataset/events')PosixPath('data/ToyDataset/events')
-
PosixPath('data/ToyDataset/precomputed_events')PosixPath('data/ToyDataset/precomputed_events')
-
PosixPathPosixPath('data/ToyDataset/precomputed_reading_measures')
-
PosixPath('data/ToyDataset/preprocessed')PosixPath('data/ToyDataset/preprocessed')
-
PosixPath('data/ToyDataset/raw')PosixPath('data/ToyDataset/raw')
-
PosixPath('data/ToyDataset')PosixPath('data/ToyDataset')
-
-
list (0 items)
-
list (0 items)
Plot Raw Samples#
To visualize the raw gaze data, we first select a recording and extract the horizontal and vertical coordinates.
# we will work with gaze data from the first recording
gaze = dataset.gaze[0]

# extract horizontal and vertical coordinates from the position column
df = gaze.samples

df = df.with_columns([
    pl.col("position").list.get(0).alias("pos_x"),
    pl.col("position").list.get(1).alias("pos_y"),
])

# Assign back
gaze.samples = df
Tsplot#
The tsplot() function produces a time series plot of gaze samples from a Gaze object. A time series plot shows how each recorded signal changes over time, with one line per selected channel (e.g., horizontal and vertical gaze position).
In this example, we plot the pos_x and pos_y channels to examine the raw gaze signal before applying any event detection or preprocessing. We observe rapid jumps in the horizontal gaze position (pos_x), and slower, more gradual changes in the vertical gaze position (pos_y).
pm.plotting.tsplot(
    gaze,
    channels=['pos_x', 'pos_y'],
    # Set separate y-axis for each channel.
    share_y=False,
    line_color="darkblue")
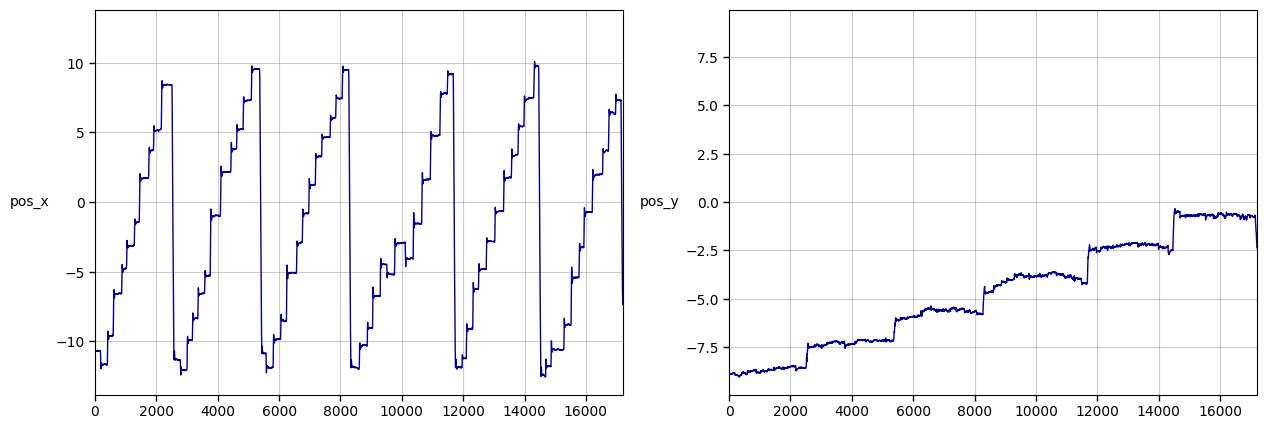
(<Figure size 1500x500 with 2 Axes>, <Axes: ylabel='pos_x'>)
Traceplot#
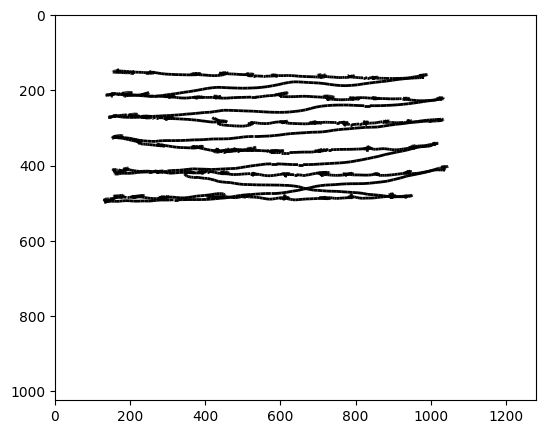
The traceplot() function visualizes the raw gaze samples as a continuous trajectory across the stimulus. In a traceplot, each gaze sample is connected in temporal order, showing how the point of regard moves over time.
Traceplots are useful for:
Verifying that gaze data have been parsed and aligned correctly.
Exploring viewing behavior across conditions or participants.
Identifying artifacts or data quality issues.
A basic traceplot can be created with only a Gaze object:
pm.plotting.traceplot(gaze)
(<Figure size 1500x500 with 1 Axes>, <Axes: >)
Detecting and Visualizing Events#
Eye-tracking data are typically segmented into events, i.e. fixations and saccades. Fixations represent moments when the eyes remain relatively still, allowing visual information to be processed, while saccades are the rapid movements between fixations that reposition the gaze. Detecting these events and computing their properties, such as fixation duration, saccade amplitude, and peak velocity, provides the foundation for analyzing visual behavior and understanding how participants explore a stimulus.
Fixations#
We can detect fixations by applying the I-VT or the I-DT method.
The I-VT (Velocity-Threshold Identification) method distinguishes fixation and saccade points based on their point-to-point velocities. Each point is classified as a fixation if its velocity is below the specified threshold. Consecutive fixation points are then merged into a single fixation. A threshold of 20 degrees/second is commonly used as a default maximum value. Read more about the IVT method in the documentation: pymovements.events.detection.ivt().
The I-DT (Dispersion-Threshold Identification) method finds fixations by grouping consecutive points within a maximum separation (dispersion) threshold and a minimum duration threshold. The algorithm slides a moving window across the data: if the dispersion within the window is below the threshold, the window represents a fixation and is gradually expanded until the dispersion exceeds the threshold.
Read more about our implementation of the IDT method: pymovements.events.detection.idt().
We will use the I-DT algorithm with different dispersion threshold values to create two different sets of fixation events.
Key Parameters:
dispersion_threshold: Maximum dispersion allowed for fixation points. Default: 1.0 degreesname: Custom name for the detected events
The mininum_duration default is 100 ms.
# Detect fixations with a stricter threshold (1.0 degrees)
dataset.detect_events('idt', dispersion_threshold=1.0, name='fixation_1.0_idt')

# Detect fixations with a standard threshold (2.7 degrees)
dataset.detect_events('idt', dispersion_threshold=2.7, name='fixation_2.7_idt')
-
DatasetDefinitionDatasetDefinition
-
NoneNone
-
NoneNone
-
NoneNone
-
NoneNone
-
ExperimentExperiment
-
EyeTrackerEyeTracker
-
NoneNone
-
NoneNone
-
NoneNone
-
NoneNone
-
10001000
-
NoneNone
-
NoneNone
-
-
10001000
-
ScreenScreen
-
6868
-
30.230.2
-
10241024
-
'upper left''upper left'
-
3838
-
12801280
-
15.59938648778295315.599386487782953
-
-15.599386487782953-15.599386487782953
-
12.50804441088254612.508044410882546
-
-12.508044410882546-12.508044410882546
-
-
-
NoneNone
-
dict (1 items)
-
'trial_{text_id:d}_{page_id:d}.csv''trial_{text_id:d}_{page_id:d}.csv'
-
-
dict (1 items)
-
dict (2 items)
-
<class 'int'><class 'int'>
-
<class 'int'><class 'int'>
-
-
-
TrueTrue
-
'pymovements Toy Dataset''pymovements Toy Dataset'
-
dict (0 items)
-
'ToyDataset''ToyDataset'
-
NoneNone
-
NoneNone
-
list (1 items)
-
ResourceDefinition
-
'gaze''gaze'
-
'pymovements-toy-dataset.zip''pymovements-toy-dataset.zip'
-
'trial_{text_id:d}_{page_id:d}.csv''trial_{text_id:d}_{page_id:d}.csv'
-
dict (2 items)
-
<class 'int'><class 'int'>
-
<class 'int'><class 'int'>
-
-
NoneNone
-
dict (4 items)
-
'timestamp''timestamp'
-
'ms''ms'
- (2 more)
-
-
'256901852c1c07581d375eef705855d6''256901852c1c07581d375eef705855d6'
-
NoneNone
-
str'https://github.com/pymovements/pymovements-toy-dataset/archive/refs/heads/main.zip'
-
-
ResourceDefinition
-
NoneNone
-
NoneNone
-
NoneNone
-
NoneNone
-
-
tuple (20 items)
-
Events
-
DataFrame (4 columns, 133 rows)shape: (133, 4)
name onset offset duration str i64 i64 i64 "fixation_1.0_idt" 1988145 1988333 188 "fixation_1.0_idt" 1988334 1988552 218 "fixation_1.0_idt" 1988557 1988693 136 "fixation_1.0_idt" 1988751 1989019 268 "fixation_1.0_idt" 1989023 1989179 156 … … … … "fixation_2.7_idt" 2003929 2004090 161 "fixation_2.7_idt" 2004091 2004363 272 "fixation_2.7_idt" 2004364 2004883 519 "fixation_2.7_idt" 2004885 2005116 231 "fixation_2.7_idt" 2005117 2005298 181 -
NoneNone
-
-
Events
-
DataFrame (4 columns, 225 rows)shape: (225, 4)
name onset offset duration str i64 i64 i64 "fixation_1.0_idt" 2008305 2008486 181 "fixation_1.0_idt" 2008487 2008612 125 "fixation_1.0_idt" 2008613 2008813 200 "fixation_1.0_idt" 2008843 2009059 216 "fixation_1.0_idt" 2009060 2009211 151 … … … … "fixation_2.7_idt" 2036840 2037175 335 "fixation_2.7_idt" 2037176 2037424 248 "fixation_2.7_idt" 2037462 2037644 182 "fixation_2.7_idt" 2037645 2037824 179 "fixation_2.7_idt" 2037825 2038103 278 -
NoneNone
-
- (18 more)
-
Events
-
dict (1 items)
-
DataFrame (3 columns, 20 rows)shape: (20, 3)
text_id page_id filepath i64 i64 str 0 1 "pymovements-toy-dataset-main/d… 0 2 "pymovements-toy-dataset-main/d… 0 3 "pymovements-toy-dataset-main/d… 0 4 "pymovements-toy-dataset-main/d… 0 5 "pymovements-toy-dataset-main/d… … … … 3 1 "pymovements-toy-dataset-main/d… 3 2 "pymovements-toy-dataset-main/d… 3 3 "pymovements-toy-dataset-main/d… 3 4 "pymovements-toy-dataset-main/d… 3 5 "pymovements-toy-dataset-main/d…
-
-
list (20 items)
-
Gaze
-
DataFrame (8 columns, 17223 rows)shape: (17_223, 8)
time stimuli_x stimuli_y pixel position velocity pos_x pos_y i64 f64 f64 list[f64] list[f64] list[f64] f64 f64 1988145 -1.0 -1.0 [206.8, 152.4] [-10.697598, -8.852399] [null, null] -10.697598 -8.852399 1988146 -1.0 -1.0 [206.9, 152.1] [-10.695183, -8.859678] [null, null] -10.695183 -8.859678 1988147 -1.0 -1.0 [207.0, 151.8] [-10.692768, -8.866956] [1.610194, -5.256267] -10.692768 -8.866956 1988148 -1.0 -1.0 [207.1, 151.7] [-10.690352, -8.869381] [0.402548, -4.447465] -10.690352 -8.869381 1988149 -1.0 -1.0 [207.0, 151.5] [-10.692768, -8.874233] [0.402561, -3.234462] -10.692768 -8.874233 … … … … … … … … 2005363 -1.0 -1.0 [361.0, 415.4] [-6.932438, -2.386672] [-63.266374, -21.085616] -6.932438 -2.386672 2005364 -1.0 -1.0 [358.0, 414.5] [-7.006376, -2.408998] [-63.249652, -19.431326] -7.006376 -2.408998 2005365 -1.0 -1.0 [355.8, 413.8] [-7.060582, -2.426362] [-60.359624, -15.710061] -7.060582 -2.426362 2005366 -1.0 -1.0 [353.1, 413.2] [-7.12709, -2.441245] [null, null] -7.12709 -2.441245 2005367 -1.0 -1.0 [351.2, 412.9] [-7.173881, -2.448686] [null, null] -7.173881 -2.448686 -
EventsEvents
-
DataFrame (4 columns, 133 rows)shape: (133, 4)
name onset offset duration str i64 i64 i64 "fixation_1.0_idt" 1988145 1988333 188 "fixation_1.0_idt" 1988334 1988552 218 "fixation_1.0_idt" 1988557 1988693 136 "fixation_1.0_idt" 1988751 1989019 268 "fixation_1.0_idt" 1989023 1989179 156 … … … … "fixation_2.7_idt" 2003929 2004090 161 "fixation_2.7_idt" 2004091 2004363 272 "fixation_2.7_idt" 2004364 2004883 519 "fixation_2.7_idt" 2004885 2005116 231 "fixation_2.7_idt" 2005117 2005298 181 -
NoneNone
-
-
NoneNone
-
ExperimentExperiment
-
EyeTrackerEyeTracker
-
NoneNone
-
NoneNone
-
NoneNone
-
NoneNone
-
10001000
-
NoneNone
-
NoneNone
-
-
10001000
-
ScreenScreen
-
6868
-
30.230.2
-
10241024
-
'upper left''upper left'
-
3838
-
12801280
-
15.59938648778295315.599386487782953
-
-15.599386487782953-15.599386487782953
-
12.50804441088254612.508044410882546
-
-12.508044410882546-12.508044410882546
-
-
-
-
Gaze
-
DataFrame (6 columns, 29799 rows)shape: (29_799, 6)
time stimuli_x stimuli_y pixel position velocity i64 f64 f64 list[f64] list[f64] list[f64] 2008305 -1.0 -1.0 [141.4, 153.6] [-12.268583, -8.823284] [null, null] 2008306 -1.0 -1.0 [141.1, 153.2] [-12.275749, -8.832989] [null, null] 2008307 -1.0 -1.0 [140.7, 152.8] [-12.285302, -8.842695] [-5.572617, -6.065816] 2008308 -1.0 -1.0 [140.6, 152.7] [-12.28769, -8.845121] [-3.582268, -4.043733] 2008309 -1.0 -1.0 [140.5, 152.6] [-12.290078, -8.847547] [-2.388085, -2.021821] … … … … … … 2038099 -1.0 -1.0 [273.8, 773.8] [-9.071149, 6.490168] [1.21962, 1.635403] 2038100 -1.0 -1.0 [273.8, 774.1] [-9.071149, 6.497527] [1.626175, 4.497406] 2038101 -1.0 -1.0 [273.9, 774.5] [-9.06871, 6.50734] [1.626186, 1.635423] 2038102 -1.0 -1.0 [274.0, 774.4] [-9.066271, 6.504886] [null, null] 2038103 -1.0 -1.0 [274.0, 773.9] [-9.066271, 6.492621] [null, null] -
EventsEvents
-
DataFrame (4 columns, 225 rows)shape: (225, 4)
name onset offset duration str i64 i64 i64 "fixation_1.0_idt" 2008305 2008486 181 "fixation_1.0_idt" 2008487 2008612 125 "fixation_1.0_idt" 2008613 2008813 200 "fixation_1.0_idt" 2008843 2009059 216 "fixation_1.0_idt" 2009060 2009211 151 … … … … "fixation_2.7_idt" 2036840 2037175 335 "fixation_2.7_idt" 2037176 2037424 248 "fixation_2.7_idt" 2037462 2037644 182 "fixation_2.7_idt" 2037645 2037824 179 "fixation_2.7_idt" 2037825 2038103 278 -
NoneNone
-
-
NoneNone
-
ExperimentExperiment
-
EyeTrackerEyeTracker
-
NoneNone
-
NoneNone
-
NoneNone
-
NoneNone
-
10001000
-
NoneNone
-
NoneNone
-
-
10001000
-
ScreenScreen
-
6868
-
30.230.2
-
10241024
-
'upper left''upper left'
-
3838
-
12801280
-
15.59938648778295315.599386487782953
-
-15.599386487782953-15.599386487782953
-
12.50804441088254612.508044410882546
-
-12.508044410882546-12.508044410882546
-
-
-
- (18 more)
-
Gaze
-
PosixPath('data/ToyDataset')PosixPath('data/ToyDataset')
-
DatasetPathsDatasetPaths
-
PosixPath('data/ToyDataset')PosixPath('data/ToyDataset')
-
PosixPath('data/ToyDataset/downloads')PosixPath('data/ToyDataset/downloads')
-
PosixPath('data/ToyDataset/events')PosixPath('data/ToyDataset/events')
-
PosixPath('data/ToyDataset/precomputed_events')PosixPath('data/ToyDataset/precomputed_events')
-
PosixPathPosixPath('data/ToyDataset/precomputed_reading_measures')
-
PosixPath('data/ToyDataset/preprocessed')PosixPath('data/ToyDataset/preprocessed')
-
PosixPath('data/ToyDataset/raw')PosixPath('data/ToyDataset/raw')
-
PosixPath('data/ToyDataset')PosixPath('data/ToyDataset')
-
-
list (0 items)
-
list (0 items)
Calculating Fixation Properties#
The property location will be used for visualization purposes. It is added as a separate column named location in the events DataFrame, containing the centroid coordinates of each fixation.
Key Parameter:
position_column: Specifies which coordinate system to use for the property. By default, fixation centroids are computed in degrees of visual angle. To obtain fixation centroids in pixel coordinates, this parameter must be explicitly set topixel.
# Compute fixation locations using pixel coordinates
dataset.compute_event_properties(("location", {'position_column': 'pixel'}))
-
DatasetDefinitionDatasetDefinition
-
NoneNone
-
NoneNone
-
NoneNone
-
NoneNone
-
ExperimentExperiment
-
EyeTrackerEyeTracker
-
NoneNone
-
NoneNone
-
NoneNone
-
NoneNone
-
10001000
-
NoneNone
-
NoneNone
-
-
10001000
-
ScreenScreen
-
6868
-
30.230.2
-
10241024
-
'upper left''upper left'
-
3838
-
12801280
-
15.59938648778295315.599386487782953
-
-15.599386487782953-15.599386487782953
-
12.50804441088254612.508044410882546
-
-12.508044410882546-12.508044410882546
-
-
-
NoneNone
-
dict (1 items)
-
'trial_{text_id:d}_{page_id:d}.csv''trial_{text_id:d}_{page_id:d}.csv'
-
-
dict (1 items)
-
dict (2 items)
-
<class 'int'><class 'int'>
-
<class 'int'><class 'int'>
-
-
-
TrueTrue
-
'pymovements Toy Dataset''pymovements Toy Dataset'
-
dict (0 items)
-
'ToyDataset''ToyDataset'
-
NoneNone
-
NoneNone
-
list (1 items)
-
ResourceDefinition
-
'gaze''gaze'
-
'pymovements-toy-dataset.zip''pymovements-toy-dataset.zip'
-
'trial_{text_id:d}_{page_id:d}.csv''trial_{text_id:d}_{page_id:d}.csv'
-
dict (2 items)
-
<class 'int'><class 'int'>
-
<class 'int'><class 'int'>
-
-
NoneNone
-
dict (4 items)
-
'timestamp''timestamp'
-
'ms''ms'
- (2 more)
-
-
'256901852c1c07581d375eef705855d6''256901852c1c07581d375eef705855d6'
-
NoneNone
-
str'https://github.com/pymovements/pymovements-toy-dataset/archive/refs/heads/main.zip'
-
-
ResourceDefinition
-
NoneNone
-
NoneNone
-
NoneNone
-
NoneNone
-
-
tuple (20 items)
-
Events
-
DataFrame (5 columns, 133 rows)shape: (133, 5)
name onset offset duration location str i64 i64 i64 list[f64] "fixation_1.0_idt" 1988145 1988333 188 [206.379894, 151.608995] "fixation_1.0_idt" 1988334 1988552 218 [166.777626, 147.768037] "fixation_1.0_idt" 1988557 1988693 136 [251.581752, 153.005839] "fixation_1.0_idt" 1988751 1989019 268 [375.653903, 156.864684] "fixation_1.0_idt" 1989023 1989179 156 [447.535032, 153.984713] … … … … … "fixation_2.7_idt" 2003929 2004090 161 [512.546914, 480.77963] "fixation_2.7_idt" 2004091 2004363 272 [612.157875, 484.94652] "fixation_2.7_idt" 2004364 2004883 519 [742.400962, 484.479615] "fixation_2.7_idt" 2004885 2005116 231 [894.493966, 480.440948] "fixation_2.7_idt" 2005117 2005298 181 [932.2, 481.715385] -
NoneNone
-
-
Events
-
DataFrame (5 columns, 225 rows)shape: (225, 5)
name onset offset duration location str i64 i64 i64 list[f64] "fixation_1.0_idt" 2008305 2008486 181 [142.429121, 152.132418] "fixation_1.0_idt" 2008487 2008612 125 [161.310317, 136.746032] "fixation_1.0_idt" 2008613 2008813 200 [227.342289, 140.28806] "fixation_1.0_idt" 2008843 2009059 216 [407.776498, 146.75576] "fixation_1.0_idt" 2009060 2009211 151 [384.065789, 149.804605] … … … … … "fixation_2.7_idt" 2036840 2037175 335 [963.833036, 721.000298] "fixation_2.7_idt" 2037176 2037424 248 [887.351406, 719.088755] "fixation_2.7_idt" 2037462 2037644 182 [212.069399, 768.237705] "fixation_2.7_idt" 2037645 2037824 179 [174.477222, 781.421111] "fixation_2.7_idt" 2037825 2038103 278 [270.465591, 773.858781] -
NoneNone
-
- (18 more)
-
Events
-
dict (1 items)
-
DataFrame (3 columns, 20 rows)shape: (20, 3)
text_id page_id filepath i64 i64 str 0 1 "pymovements-toy-dataset-main/d… 0 2 "pymovements-toy-dataset-main/d… 0 3 "pymovements-toy-dataset-main/d… 0 4 "pymovements-toy-dataset-main/d… 0 5 "pymovements-toy-dataset-main/d… … … … 3 1 "pymovements-toy-dataset-main/d… 3 2 "pymovements-toy-dataset-main/d… 3 3 "pymovements-toy-dataset-main/d… 3 4 "pymovements-toy-dataset-main/d… 3 5 "pymovements-toy-dataset-main/d…
-
-
list (20 items)
-
Gaze
-
DataFrame (8 columns, 17223 rows)shape: (17_223, 8)
time stimuli_x stimuli_y pixel position velocity pos_x pos_y i64 f64 f64 list[f64] list[f64] list[f64] f64 f64 1988145 -1.0 -1.0 [206.8, 152.4] [-10.697598, -8.852399] [null, null] -10.697598 -8.852399 1988146 -1.0 -1.0 [206.9, 152.1] [-10.695183, -8.859678] [null, null] -10.695183 -8.859678 1988147 -1.0 -1.0 [207.0, 151.8] [-10.692768, -8.866956] [1.610194, -5.256267] -10.692768 -8.866956 1988148 -1.0 -1.0 [207.1, 151.7] [-10.690352, -8.869381] [0.402548, -4.447465] -10.690352 -8.869381 1988149 -1.0 -1.0 [207.0, 151.5] [-10.692768, -8.874233] [0.402561, -3.234462] -10.692768 -8.874233 … … … … … … … … 2005363 -1.0 -1.0 [361.0, 415.4] [-6.932438, -2.386672] [-63.266374, -21.085616] -6.932438 -2.386672 2005364 -1.0 -1.0 [358.0, 414.5] [-7.006376, -2.408998] [-63.249652, -19.431326] -7.006376 -2.408998 2005365 -1.0 -1.0 [355.8, 413.8] [-7.060582, -2.426362] [-60.359624, -15.710061] -7.060582 -2.426362 2005366 -1.0 -1.0 [353.1, 413.2] [-7.12709, -2.441245] [null, null] -7.12709 -2.441245 2005367 -1.0 -1.0 [351.2, 412.9] [-7.173881, -2.448686] [null, null] -7.173881 -2.448686 -
EventsEvents
-
DataFrame (5 columns, 133 rows)shape: (133, 5)
name onset offset duration location str i64 i64 i64 list[f64] "fixation_1.0_idt" 1988145 1988333 188 [206.379894, 151.608995] "fixation_1.0_idt" 1988334 1988552 218 [166.777626, 147.768037] "fixation_1.0_idt" 1988557 1988693 136 [251.581752, 153.005839] "fixation_1.0_idt" 1988751 1989019 268 [375.653903, 156.864684] "fixation_1.0_idt" 1989023 1989179 156 [447.535032, 153.984713] … … … … … "fixation_2.7_idt" 2003929 2004090 161 [512.546914, 480.77963] "fixation_2.7_idt" 2004091 2004363 272 [612.157875, 484.94652] "fixation_2.7_idt" 2004364 2004883 519 [742.400962, 484.479615] "fixation_2.7_idt" 2004885 2005116 231 [894.493966, 480.440948] "fixation_2.7_idt" 2005117 2005298 181 [932.2, 481.715385] -
NoneNone
-
-
NoneNone
-
ExperimentExperiment
-
EyeTrackerEyeTracker
-
NoneNone
-
NoneNone
-
NoneNone
-
NoneNone
-
10001000
-
NoneNone
-
NoneNone
-
-
10001000
-
ScreenScreen
-
6868
-
30.230.2
-
10241024
-
'upper left''upper left'
-
3838
-
12801280
-
15.59938648778295315.599386487782953
-
-15.599386487782953-15.599386487782953
-
12.50804441088254612.508044410882546
-
-12.508044410882546-12.508044410882546
-
-
-
-
Gaze
-
DataFrame (6 columns, 29799 rows)shape: (29_799, 6)
time stimuli_x stimuli_y pixel position velocity i64 f64 f64 list[f64] list[f64] list[f64] 2008305 -1.0 -1.0 [141.4, 153.6] [-12.268583, -8.823284] [null, null] 2008306 -1.0 -1.0 [141.1, 153.2] [-12.275749, -8.832989] [null, null] 2008307 -1.0 -1.0 [140.7, 152.8] [-12.285302, -8.842695] [-5.572617, -6.065816] 2008308 -1.0 -1.0 [140.6, 152.7] [-12.28769, -8.845121] [-3.582268, -4.043733] 2008309 -1.0 -1.0 [140.5, 152.6] [-12.290078, -8.847547] [-2.388085, -2.021821] … … … … … … 2038099 -1.0 -1.0 [273.8, 773.8] [-9.071149, 6.490168] [1.21962, 1.635403] 2038100 -1.0 -1.0 [273.8, 774.1] [-9.071149, 6.497527] [1.626175, 4.497406] 2038101 -1.0 -1.0 [273.9, 774.5] [-9.06871, 6.50734] [1.626186, 1.635423] 2038102 -1.0 -1.0 [274.0, 774.4] [-9.066271, 6.504886] [null, null] 2038103 -1.0 -1.0 [274.0, 773.9] [-9.066271, 6.492621] [null, null] -
EventsEvents
-
DataFrame (5 columns, 225 rows)shape: (225, 5)
name onset offset duration location str i64 i64 i64 list[f64] "fixation_1.0_idt" 2008305 2008486 181 [142.429121, 152.132418] "fixation_1.0_idt" 2008487 2008612 125 [161.310317, 136.746032] "fixation_1.0_idt" 2008613 2008813 200 [227.342289, 140.28806] "fixation_1.0_idt" 2008843 2009059 216 [407.776498, 146.75576] "fixation_1.0_idt" 2009060 2009211 151 [384.065789, 149.804605] … … … … … "fixation_2.7_idt" 2036840 2037175 335 [963.833036, 721.000298] "fixation_2.7_idt" 2037176 2037424 248 [887.351406, 719.088755] "fixation_2.7_idt" 2037462 2037644 182 [212.069399, 768.237705] "fixation_2.7_idt" 2037645 2037824 179 [174.477222, 781.421111] "fixation_2.7_idt" 2037825 2038103 278 [270.465591, 773.858781] -
NoneNone
-
-
NoneNone
-
ExperimentExperiment
-
EyeTrackerEyeTracker
-
NoneNone
-
NoneNone
-
NoneNone
-
NoneNone
-
10001000
-
NoneNone
-
NoneNone
-
-
10001000
-
ScreenScreen
-
6868
-
30.230.2
-
10241024
-
'upper left''upper left'
-
3838
-
12801280
-
15.59938648778295315.599386487782953
-
-15.599386487782953-15.599386487782953
-
12.50804441088254612.508044410882546
-
-12.508044410882546-12.508044410882546
-
-
-
- (18 more)
-
Gaze
-
PosixPath('data/ToyDataset')PosixPath('data/ToyDataset')
-
DatasetPathsDatasetPaths
-
PosixPath('data/ToyDataset')PosixPath('data/ToyDataset')
-
PosixPath('data/ToyDataset/downloads')PosixPath('data/ToyDataset/downloads')
-
PosixPath('data/ToyDataset/events')PosixPath('data/ToyDataset/events')
-
PosixPath('data/ToyDataset/precomputed_events')PosixPath('data/ToyDataset/precomputed_events')
-
PosixPathPosixPath('data/ToyDataset/precomputed_reading_measures')
-
PosixPath('data/ToyDataset/preprocessed')PosixPath('data/ToyDataset/preprocessed')
-
PosixPath('data/ToyDataset/raw')PosixPath('data/ToyDataset/raw')
-
PosixPath('data/ToyDataset')PosixPath('data/ToyDataset')
-
-
list (0 items)
-
list (0 items)
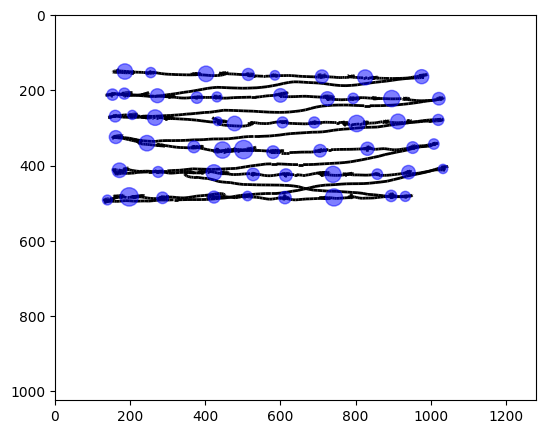
Creating the Scanpath Plot#
The scanpathplot() function visualizes the sequence of fixations as circles placed at their spatial locations, with circle size indicating fixation duration. Each fixation has an arrow pointing to the next fixation in viewing order.
# show all unique event names in the gaze events frame
gaze.events.frame.select('name').unique().to_series().to_list()
['fixation_2.7_idt', 'fixation_1.0_idt']
pm.plotting.scanpathplot(gaze, event_name='fixation_1.0_idt')
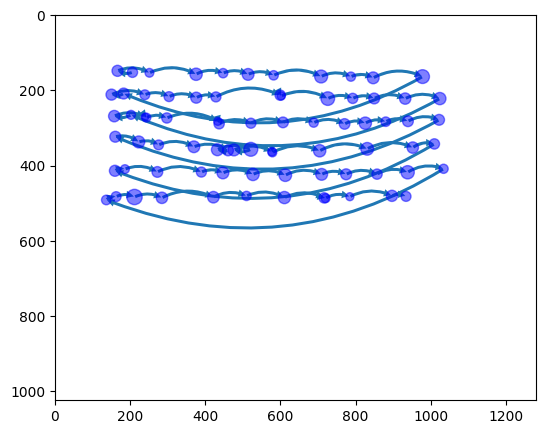
(<Figure size 1500x500 with 1 Axes>, <Axes: >)
pm.plotting.scanpathplot(gaze, event_name='fixation_2.7_idt')
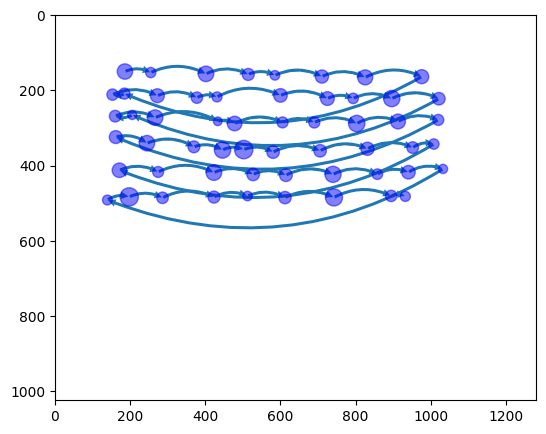
(<Figure size 1500x500 with 1 Axes>, <Axes: >)
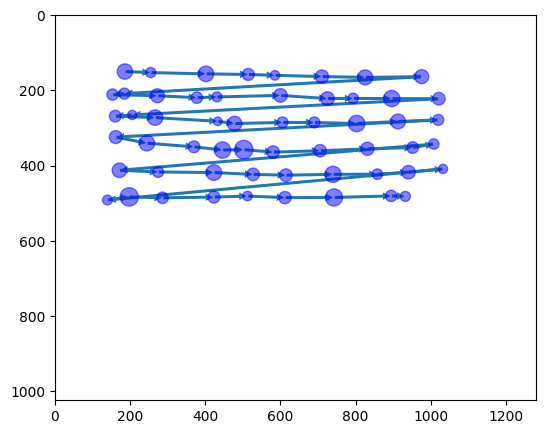
By default, arrows are curved to prevent overlap with the stimulus (e.g., text). The curvature of the arrows is controlled by the arrow_rad parameter. Setting arrow_rad to zero disables the curvature and results in straight arrows, as shown below.
pm.plotting.scanpathplot(gaze, event_name='fixation_2.7_idt', arrow_rad=0.0)
(<Figure size 1500x500 with 1 Axes>, <Axes: >)
We can create an enhanced visualization by overlaying the scanpath plot with the traceplot. This shows both the fixations, their duration, and the raw gaze trajectory.
pm.plotting.scanpathplot(gaze, event_name='fixation_2.7_idt', add_traceplot=True, add_arrows=False)
(<Figure size 1500x500 with 1 Axes>, <Axes: >)
Heatmap Plotting#
The heatmap visualizes the spatial distribution of gaze samples across the experiment screen. Each cell’s color value reflects the cumulative time (in seconds) that the gaze samples were recorded at that position.
We can use the heatmap() from the pymovements library with the default values for gridsize (10x10), interpolation, and the colorbar.
pm.plotting.heatmap(gaze)
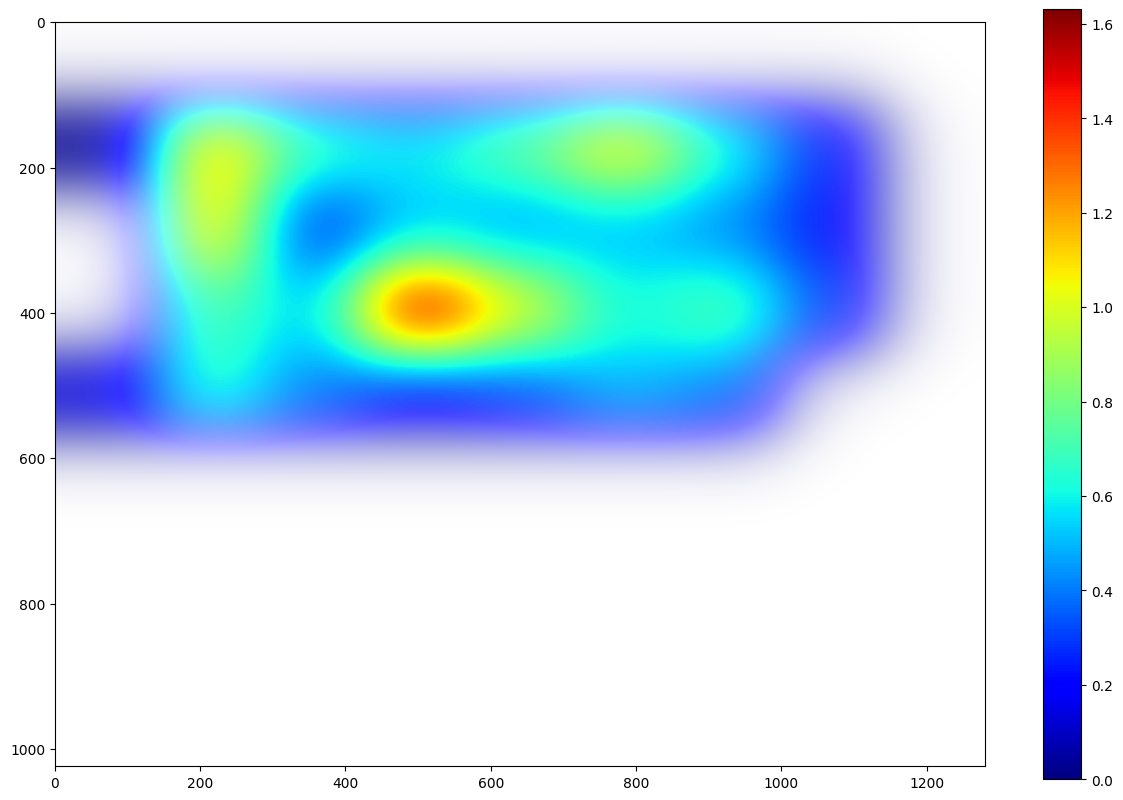
(<Figure size 1500x1000 with 2 Axes>, <Axes: >)
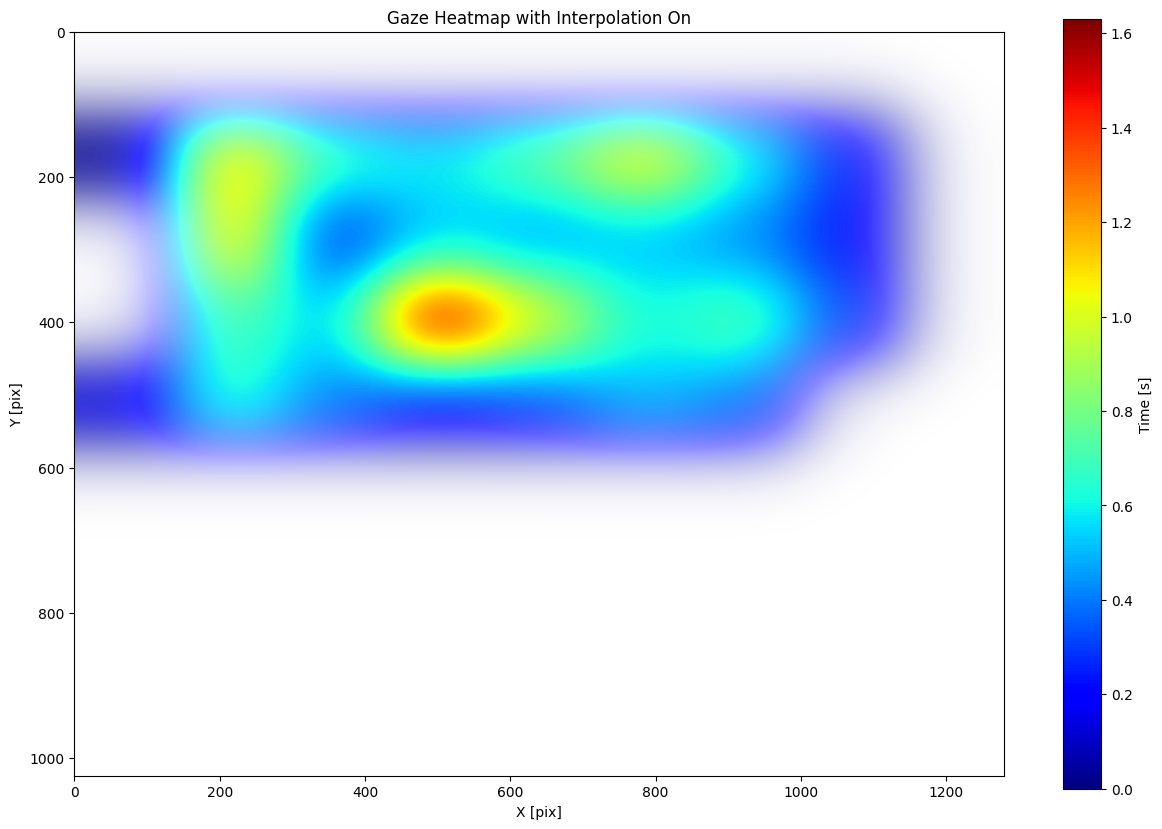
Furthermore, we can customize various aspects of the heatmap plot, such as the grid size, color map, and the labels.
fig, ax = pm.plotting.heatmap(
    gaze=gaze,
    position_column='pixel',
    origin='upper',
    show_cbar=True,
    cbar_label='Time [s]',
    title='Gaze Heatmap with Interpolation On',
    xlabel='X [pix]',
    ylabel='Y [pix]',
    gridsize=[10, 10],
)
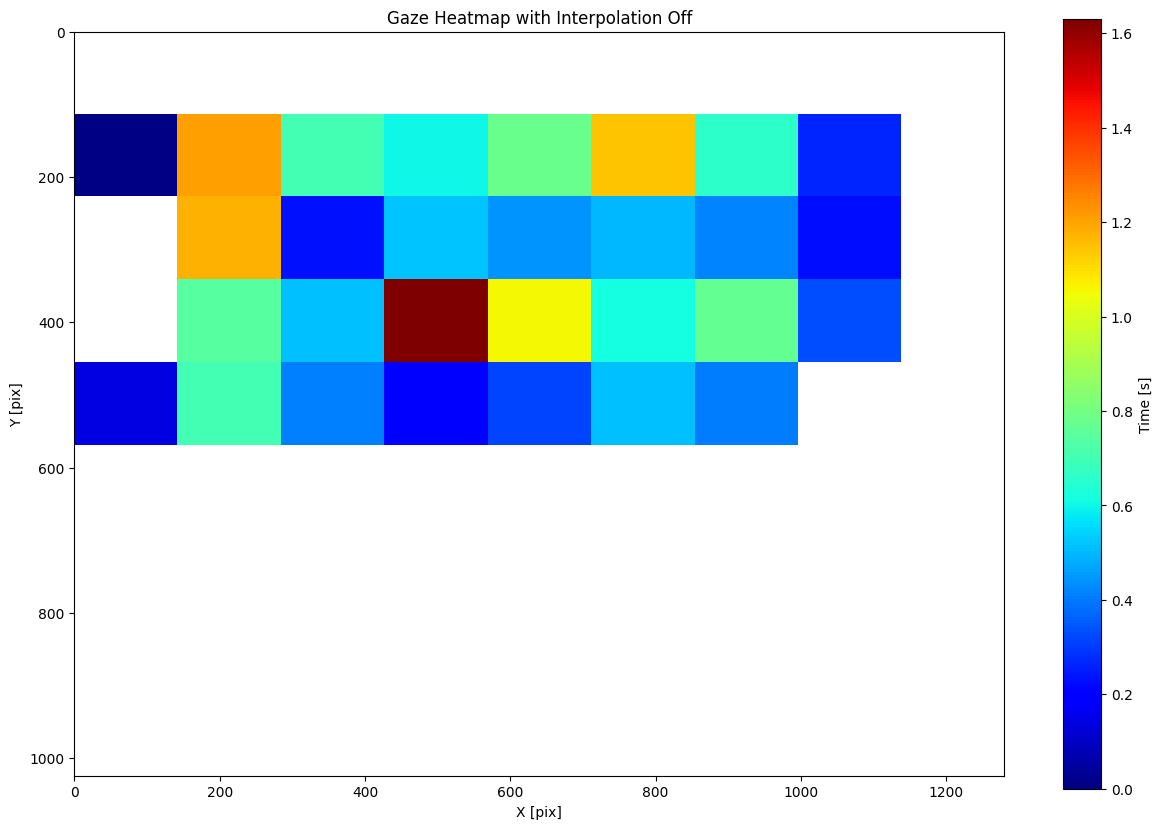
To better understand the effect of the gridsize parameter on the heatmap, we can turn off the interpolation. By doing this, we can clearly visualize the individual bins used to calculate the heatmap. With interpolation turned off, the heatmap will display the raw bin values rather than a smoothed representation.
fig, ax = pm.plotting.heatmap(
    gaze,
    position_column='pixel',
    origin='upper',
    show_cbar=True,
    cbar_label='Time [s]',
    title='Gaze Heatmap with Interpolation Off',
    xlabel='X [pix]',
    ylabel='Y [pix]',
    gridsize=[10, 10],
    interpolation='none'
)
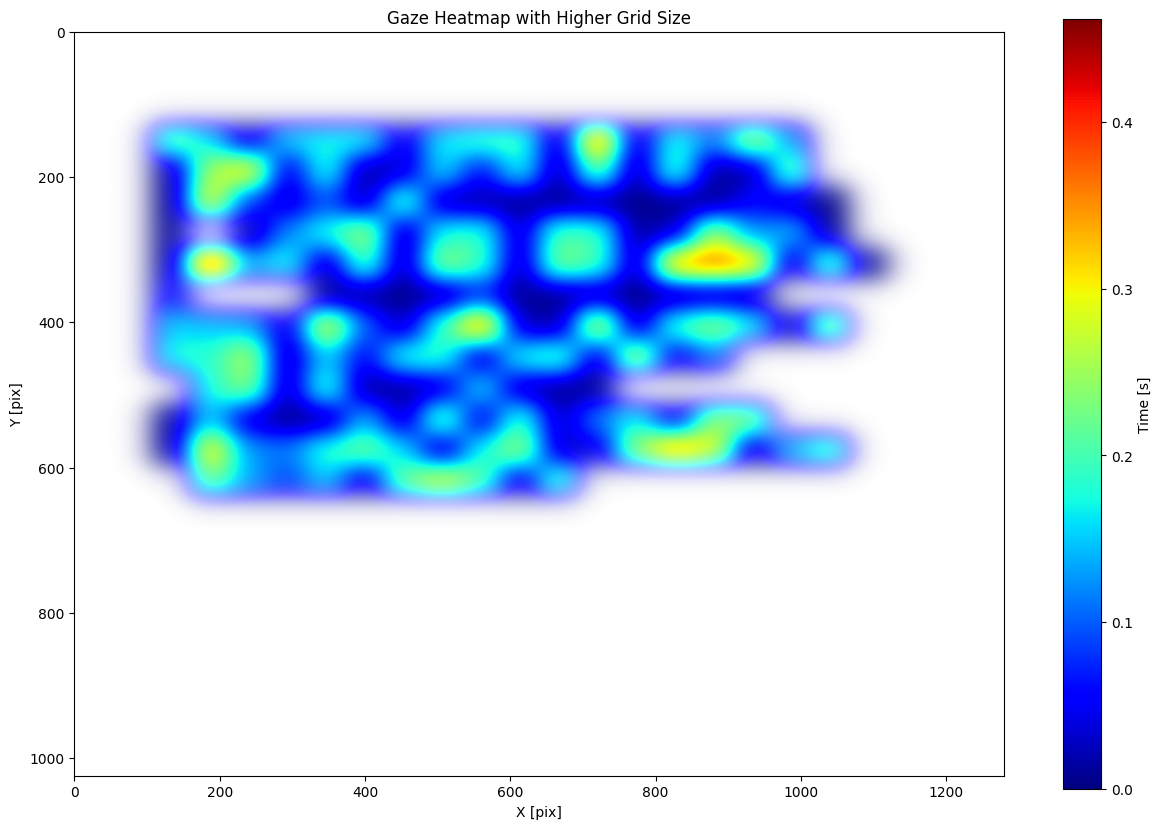
Increasing the gridsize parameter results in a finer grid and more detailed heatmap representation. With a higher grid size, we divide the plot into smaller bins, which can capture more nuances in the data distribution
fig, ax = pm.plotting.heatmap(
    dataset.gaze[5],
    position_column='pixel',
    origin='upper',
    show_cbar=True,
    cbar_label='Time [s]',
    title='Gaze Heatmap with Higher Grid Size',
    xlabel='X [pix]',
    ylabel='Y [pix]',
    gridsize=[25, 25]
)
Detect Saccades and Compute Amplitude and Peak Velocity#
Saccades are rapid eye movements that shift the point of fixation from one location to another. We detect saccades (or micro-saccades) from the velocity sequence of gaze data using the microsaccades() algorithm. This algorithm implements a noise-adaptive velocity threshold, meaning that the detection threshold automatically scales with the noise level of the velocity signal.
Key Parameters:
threshold_factor: Multiplier used to determine the velocity threshold relative to the noise level of the signal. The default value is 6. A higher factor makes the algorithm more conservative (detects fewer saccades), while a lower factor makes it more sensitive.minimum_duration: Defines how long a velocity peak must persist to be classified as a saccade. The duration is expressed in the same units as timesteps. If no timesteps are provided, the value refers to the number of samples (default = 6), which corresponds to about 12 ms at a 500 Hz sampling rate. Shorter events are ignored as noise.
# detect saccades using the microsaccades algorithm
dataset.detect_events('microsaccades', minimum_duration=6, threshold_factor=6)
-
DatasetDefinitionDatasetDefinition
-
NoneNone
-
NoneNone
-
NoneNone
-
NoneNone
-
ExperimentExperiment
-
EyeTrackerEyeTracker
-
NoneNone
-
NoneNone
-
NoneNone
-
NoneNone
-
10001000
-
NoneNone
-
NoneNone
-
-
10001000
-
ScreenScreen
-
6868
-
30.230.2
-
10241024
-
'upper left''upper left'
-
3838
-
12801280
-
15.59938648778295315.599386487782953
-
-15.599386487782953-15.599386487782953
-
12.50804441088254612.508044410882546
-
-12.508044410882546-12.508044410882546
-
-
-
NoneNone
-
dict (1 items)
-
'trial_{text_id:d}_{page_id:d}.csv''trial_{text_id:d}_{page_id:d}.csv'
-
-
dict (1 items)
-
dict (2 items)
-
<class 'int'><class 'int'>
-
<class 'int'><class 'int'>
-
-
-
TrueTrue
-
'pymovements Toy Dataset''pymovements Toy Dataset'
-
dict (0 items)
-
'ToyDataset''ToyDataset'
-
NoneNone
-
NoneNone
-
list (1 items)
-
ResourceDefinition
-
'gaze''gaze'
-
'pymovements-toy-dataset.zip''pymovements-toy-dataset.zip'
-
'trial_{text_id:d}_{page_id:d}.csv''trial_{text_id:d}_{page_id:d}.csv'
-
dict (2 items)
-
<class 'int'><class 'int'>
-
<class 'int'><class 'int'>
-
-
NoneNone
-
dict (4 items)
-
'timestamp''timestamp'
-
'ms''ms'
- (2 more)
-
-
'256901852c1c07581d375eef705855d6''256901852c1c07581d375eef705855d6'
-
NoneNone
-
str'https://github.com/pymovements/pymovements-toy-dataset/archive/refs/heads/main.zip'
-
-
ResourceDefinition
-
NoneNone
-
NoneNone
-
NoneNone
-
NoneNone
-
-
tuple (20 items)
-
Events
-
DataFrame (5 columns, 275 rows)shape: (275, 5)
name onset offset duration location str i64 i64 i64 list[f64] "fixation_1.0_idt" 1988145 1988333 188 [206.379894, 151.608995] "fixation_1.0_idt" 1988334 1988552 218 [166.777626, 147.768037] "fixation_1.0_idt" 1988557 1988693 136 [251.581752, 153.005839] "fixation_1.0_idt" 1988751 1989019 268 [375.653903, 156.864684] "fixation_1.0_idt" 1989023 1989179 156 [447.535032, 153.984713] … … … … … "saccade" 2005110 2005126 16 null "saccade" 2005128 2005138 10 null "saccade" 2005288 2005345 57 null "saccade" 2005347 2005356 9 null "saccade" 2005359 2005365 6 null -
NoneNone
-
-
Events
-
DataFrame (5 columns, 458 rows)shape: (458, 5)
name onset offset duration location str i64 i64 i64 list[f64] "fixation_1.0_idt" 2008305 2008486 181 [142.429121, 152.132418] "fixation_1.0_idt" 2008487 2008612 125 [161.310317, 136.746032] "fixation_1.0_idt" 2008613 2008813 200 [227.342289, 140.28806] "fixation_1.0_idt" 2008843 2009059 216 [407.776498, 146.75576] "fixation_1.0_idt" 2009060 2009211 151 [384.065789, 149.804605] … … … … … "saccade" 2037638 2037654 16 null "saccade" 2037656 2037666 10 null "saccade" 2037812 2037830 18 null "saccade" 2037832 2037839 7 null "saccade" 2037845 2037851 6 null -
NoneNone
-
- (18 more)
-
Events
-
dict (1 items)
-
DataFrame (3 columns, 20 rows)shape: (20, 3)
text_id page_id filepath i64 i64 str 0 1 "pymovements-toy-dataset-main/d… 0 2 "pymovements-toy-dataset-main/d… 0 3 "pymovements-toy-dataset-main/d… 0 4 "pymovements-toy-dataset-main/d… 0 5 "pymovements-toy-dataset-main/d… … … … 3 1 "pymovements-toy-dataset-main/d… 3 2 "pymovements-toy-dataset-main/d… 3 3 "pymovements-toy-dataset-main/d… 3 4 "pymovements-toy-dataset-main/d… 3 5 "pymovements-toy-dataset-main/d…
-
-
list (20 items)
-
Gaze
-
DataFrame (8 columns, 17223 rows)shape: (17_223, 8)
time stimuli_x stimuli_y pixel position velocity pos_x pos_y i64 f64 f64 list[f64] list[f64] list[f64] f64 f64 1988145 -1.0 -1.0 [206.8, 152.4] [-10.697598, -8.852399] [null, null] -10.697598 -8.852399 1988146 -1.0 -1.0 [206.9, 152.1] [-10.695183, -8.859678] [null, null] -10.695183 -8.859678 1988147 -1.0 -1.0 [207.0, 151.8] [-10.692768, -8.866956] [1.610194, -5.256267] -10.692768 -8.866956 1988148 -1.0 -1.0 [207.1, 151.7] [-10.690352, -8.869381] [0.402548, -4.447465] -10.690352 -8.869381 1988149 -1.0 -1.0 [207.0, 151.5] [-10.692768, -8.874233] [0.402561, -3.234462] -10.692768 -8.874233 … … … … … … … … 2005363 -1.0 -1.0 [361.0, 415.4] [-6.932438, -2.386672] [-63.266374, -21.085616] -6.932438 -2.386672 2005364 -1.0 -1.0 [358.0, 414.5] [-7.006376, -2.408998] [-63.249652, -19.431326] -7.006376 -2.408998 2005365 -1.0 -1.0 [355.8, 413.8] [-7.060582, -2.426362] [-60.359624, -15.710061] -7.060582 -2.426362 2005366 -1.0 -1.0 [353.1, 413.2] [-7.12709, -2.441245] [null, null] -7.12709 -2.441245 2005367 -1.0 -1.0 [351.2, 412.9] [-7.173881, -2.448686] [null, null] -7.173881 -2.448686 -
EventsEvents
-
DataFrame (5 columns, 275 rows)shape: (275, 5)
name onset offset duration location str i64 i64 i64 list[f64] "fixation_1.0_idt" 1988145 1988333 188 [206.379894, 151.608995] "fixation_1.0_idt" 1988334 1988552 218 [166.777626, 147.768037] "fixation_1.0_idt" 1988557 1988693 136 [251.581752, 153.005839] "fixation_1.0_idt" 1988751 1989019 268 [375.653903, 156.864684] "fixation_1.0_idt" 1989023 1989179 156 [447.535032, 153.984713] … … … … … "saccade" 2005110 2005126 16 null "saccade" 2005128 2005138 10 null "saccade" 2005288 2005345 57 null "saccade" 2005347 2005356 9 null "saccade" 2005359 2005365 6 null -
NoneNone
-
-
NoneNone
-
ExperimentExperiment
-
EyeTrackerEyeTracker
-
NoneNone
-
NoneNone
-
NoneNone
-
NoneNone
-
10001000
-
NoneNone
-
NoneNone
-
-
10001000
-
ScreenScreen
-
6868
-
30.230.2
-
10241024
-
'upper left''upper left'
-
3838
-
12801280
-
15.59938648778295315.599386487782953
-
-15.599386487782953-15.599386487782953
-
12.50804441088254612.508044410882546
-
-12.508044410882546-12.508044410882546
-
-
-
-
Gaze
-
DataFrame (6 columns, 29799 rows)shape: (29_799, 6)
time stimuli_x stimuli_y pixel position velocity i64 f64 f64 list[f64] list[f64] list[f64] 2008305 -1.0 -1.0 [141.4, 153.6] [-12.268583, -8.823284] [null, null] 2008306 -1.0 -1.0 [141.1, 153.2] [-12.275749, -8.832989] [null, null] 2008307 -1.0 -1.0 [140.7, 152.8] [-12.285302, -8.842695] [-5.572617, -6.065816] 2008308 -1.0 -1.0 [140.6, 152.7] [-12.28769, -8.845121] [-3.582268, -4.043733] 2008309 -1.0 -1.0 [140.5, 152.6] [-12.290078, -8.847547] [-2.388085, -2.021821] … … … … … … 2038099 -1.0 -1.0 [273.8, 773.8] [-9.071149, 6.490168] [1.21962, 1.635403] 2038100 -1.0 -1.0 [273.8, 774.1] [-9.071149, 6.497527] [1.626175, 4.497406] 2038101 -1.0 -1.0 [273.9, 774.5] [-9.06871, 6.50734] [1.626186, 1.635423] 2038102 -1.0 -1.0 [274.0, 774.4] [-9.066271, 6.504886] [null, null] 2038103 -1.0 -1.0 [274.0, 773.9] [-9.066271, 6.492621] [null, null] -
EventsEvents
-
DataFrame (5 columns, 458 rows)shape: (458, 5)
name onset offset duration location str i64 i64 i64 list[f64] "fixation_1.0_idt" 2008305 2008486 181 [142.429121, 152.132418] "fixation_1.0_idt" 2008487 2008612 125 [161.310317, 136.746032] "fixation_1.0_idt" 2008613 2008813 200 [227.342289, 140.28806] "fixation_1.0_idt" 2008843 2009059 216 [407.776498, 146.75576] "fixation_1.0_idt" 2009060 2009211 151 [384.065789, 149.804605] … … … … … "saccade" 2037638 2037654 16 null "saccade" 2037656 2037666 10 null "saccade" 2037812 2037830 18 null "saccade" 2037832 2037839 7 null "saccade" 2037845 2037851 6 null -
NoneNone
-
-
NoneNone
-
ExperimentExperiment
-
EyeTrackerEyeTracker
-
NoneNone
-
NoneNone
-
NoneNone
-
NoneNone
-
10001000
-
NoneNone
-
NoneNone
-
-
10001000
-
ScreenScreen
-
6868
-
30.230.2
-
10241024
-
'upper left''upper left'
-
3838
-
12801280
-
15.59938648778295315.599386487782953
-
-15.599386487782953-15.599386487782953
-
12.50804441088254612.508044410882546
-
-12.508044410882546-12.508044410882546
-
-
-
- (18 more)
-
Gaze
-
PosixPath('data/ToyDataset')PosixPath('data/ToyDataset')
-
DatasetPathsDatasetPaths
-
PosixPath('data/ToyDataset')PosixPath('data/ToyDataset')
-
PosixPath('data/ToyDataset/downloads')PosixPath('data/ToyDataset/downloads')
-
PosixPath('data/ToyDataset/events')PosixPath('data/ToyDataset/events')
-
PosixPath('data/ToyDataset/precomputed_events')PosixPath('data/ToyDataset/precomputed_events')
-
PosixPathPosixPath('data/ToyDataset/precomputed_reading_measures')
-
PosixPath('data/ToyDataset/preprocessed')PosixPath('data/ToyDataset/preprocessed')
-
PosixPath('data/ToyDataset/raw')PosixPath('data/ToyDataset/raw')
-
PosixPath('data/ToyDataset')PosixPath('data/ToyDataset')
-
-
list (0 items)
-
list (0 items)
# compute amplitude and peak velocity of the detected saccades
dataset.compute_event_properties(['amplitude', 'peak_velocity'])

#  the DataFrame with detected events should now contain the following columns:
#  name, onset, offset, duration, amplitude, peak_velocity, location
dataset.events[0]
-
DataFrame (7 columns, 275 rows)shape: (275, 7)
name onset offset duration location amplitude peak_velocity str i64 i64 i64 list[f64] f64 f64 "fixation_1.0_idt" 1988145 1988333 188 [206.379894, 151.608995] 1.031626 129.856451 "fixation_1.0_idt" 1988334 1988552 218 [166.777626, 147.768037] 0.873256 180.394462 "fixation_1.0_idt" 1988557 1988693 136 [251.581752, 153.005839] 0.879847 162.993188 "fixation_1.0_idt" 1988751 1989019 268 [375.653903, 156.864684] 0.988497 199.578073 "fixation_1.0_idt" 1989023 1989179 156 [447.535032, 153.984713] 0.924994 176.901126 … … … … … … … "saccade" 2005110 2005126 16 null 1.405354 137.917594 "saccade" 2005128 2005138 10 null 0.44098 61.197926 "saccade" 2005288 2005345 57 null 14.682541 352.550667 "saccade" 2005347 2005356 9 null 0.629861 85.484987 "saccade" 2005359 2005365 6 null 0.368268 66.68761 -
NoneNone
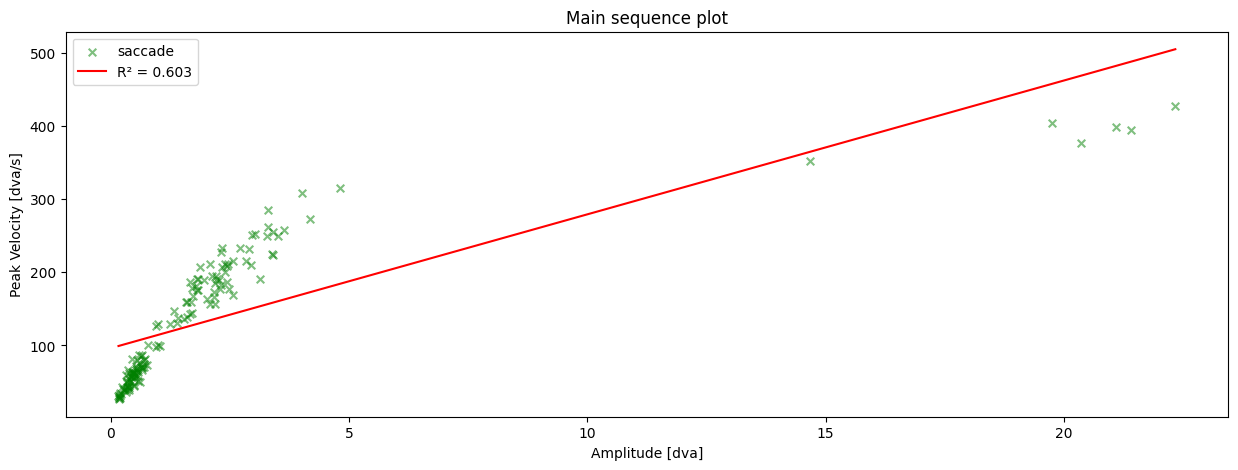
Plotting the Saccadic Main Sequence#
The saccadic main sequence describes the characteristic relationship between a saccade’s amplitude and its peak velocity: larger saccades tend to be faster, following a nonlinear, saturating curve. It is commonly used to validate saccade detection and assess data quality, since deviations from the expected pattern can indicate recording errors or atypical oculomotor behavior.
Optionally, a linear fit can be added to the plot (via fit=True), together with an evaluation metric (fit_measure='r2' or 's') to quantify how well the detected saccades follow the expected main-sequence relationship.
We employ the main_sequence_plot() function to createt this visualization.
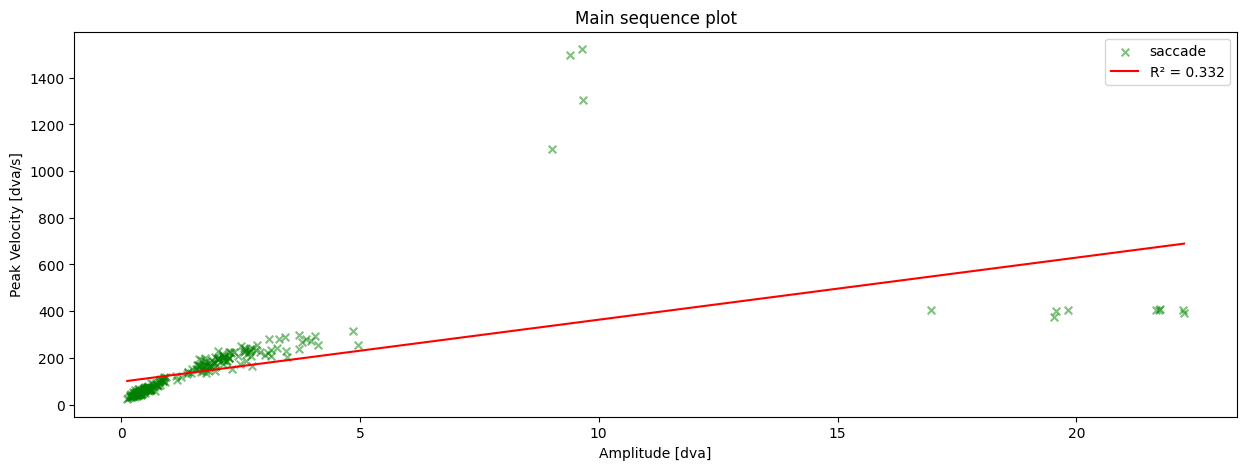
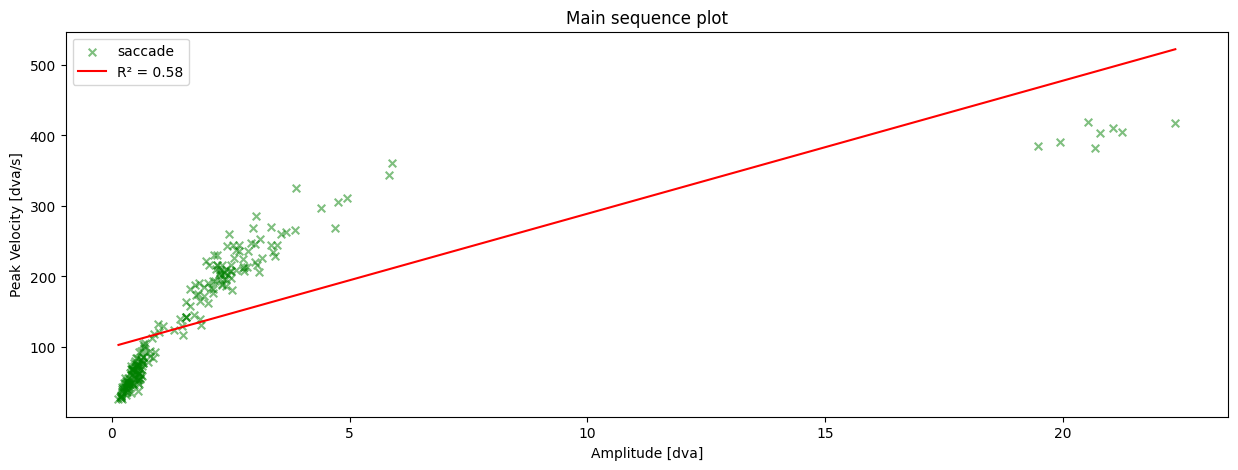
# show the first three event dataframes.
# note that you can adjust the styling of the plot, e.g. setting a low
# alpha value allows you to change transparency to see overlapping data points
for event_df in dataset.events[:3]:
    pm.plotting.main_sequence_plot(
        event_df,
        event_name='saccade',
        fit=True,
        title='Main sequence plot',
        marker='x',
        marker_size=30,
        marker_color='green',
        marker_alpha=0.5,
    )